Function-based, pathways, GO terms and compounds association analysis in GeneAnalytics aims to identify potential associations of gene sets with pathways, compounds and Gene Ontology terms (biological process and molecular function). The results are ranked by relevance to the analyzed gene set.
This analysis leverages the extensive sources of annotated data integrated and modeled in GeneCards®, the human genome database, MalaCards, the human disease database and PathCards, the human unified pathways database.
Pathways, GO terms and Compounds analysis of your gene set by GeneAnalytics can help you:
Watch case studies which demonstrate the gene set function analysis and relevant applications.
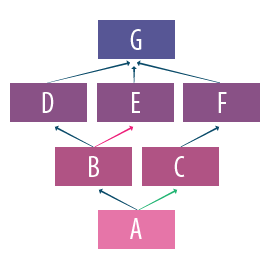
The analysis of a gene set – pathway relationships using GeneAnalytics leverages the information available in PathCards, the biological pathways database. PathCards applies a gene-content algorithm enabling unification of thousands of pathways from multiple pathway sources available in GeneCards (see PathCards statistics), and clusters them into SuperPaths. Each SuperPath is presented in a web-card, which contains a graphical representation of the pathway network, links to relevant pathway sources, an aggregated gene list and a gene interaction network illustration.
As such, by leveraging PathCards, GeneAnalytics constitutes a powerful and user-friendly tool for exploring and discovering gene interactions within biological pathways. GeneAnalytics accurately matches query genes sets to pathways and offers interlinks to related PathCards, where all the relevant pathway information is presented.
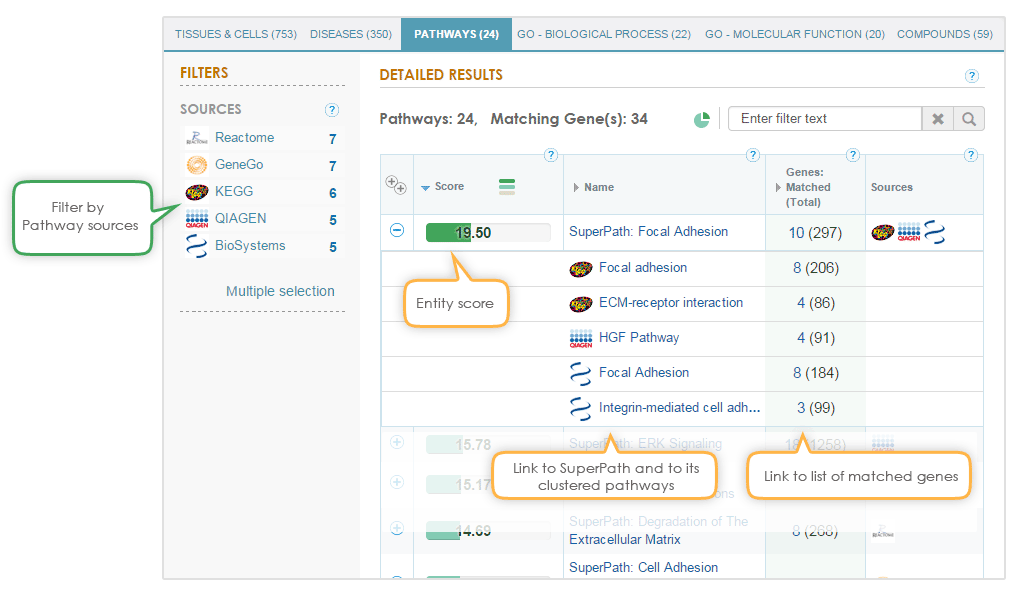
To enhance understanding of the pathway modeling, both the SuperPath and its constituent pathways are shown in the match results, with a direct link to the pathway webpage in the original database. In addition, the results can be filtered to only show matches from pathway data sources of interest.
Identifying pathways related to your gene set can help you define the roles of specific genes within each pathway and can shed light on their interactions and mechanisms of action.
Learn more about PathCards data sources.
The analysis of a gene set – gene ontology (GO) terms relationship using GeneAnalytics exploits the information available in the GO project and integrated in GeneCards – the human gene database.
The GO project provides ontology of defined terms representing gene product properties. The GO database is a relational database comprising the GO ontologies and the annotations of genes and gene products to terms in the GO.
The gene ontology database covers three domains:
GO analysis results provide added value to GeneAnalytics by adding novel and supporting information about the functional roles of the query gene set in biological processes such as development, differentiation, diseases and pathways as well as in molecular functions such as binding or catalysis.
Each GO term in the GeneAnalytics results includes a direct link to its web card in the AmiGo browser, and a list of the matched genes. The GO terms analysis add a user-friendly means of interpreting results as well as further information about the relevance of the GO term to the evaluated gene set.
Read more about the ontology and the database in the GO consortium website.
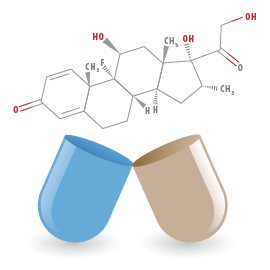
The analysis of a gene set–compound relationship using GeneAnalytics takes advantage of information in GeneCards, the human gene database that associates genes with compounds and drugs.
The information is extracted from several data sources which contain extensive biochemical and pharmacological information about drugs, small molecules and metabolites, their mechanisms of action and their targets. This information can significantly promote drug target discovery. All data sources integrate chemical, clinical and molecular biology/ biochemistry data.
Compounds unification from various data sources provides an extra value and generates integrated compound-associated gene lists, based on the following roles:
The compound-gene association is determined by either direct binding between the compound and the gene product (e.g., enzyme, carrier, transporter), or by demonstration of a functional relationship (e.g., pharmacogenomics, genetic variants and drug pathways affecting drug activity).
Each compound in the GeneAnalytics results table is linked to its web card in each specific data source, and to a list of the matched query genes. These links provide further information about the compound and its relevance to the evaluated genes.
The compound section in GeneAnalytics provides the biomedical community with a powerful but simple tool to explore potential drugs and their mechanisms of action as well as to facilitate drug target discovery
The binomial distribution is used to test the null hypothesis that the queried genes are not over-represented within any super-path, GO term or compound in the GeneAnalytics data sources.
The presented score in each section is a transformation of the resulting p-value, corrected for multiple comparisons using the false discovery rate (FDR) method; namely, higher scores indicate a better match. This score is presented by a continuous fill of the score bar. Importantly, the scores cannot be compared between different sections. However, the bar color, indicating for the matching quality: high (dark green), medium (light green), low (beige) is common for all sections. This graphic visualization of the score enables the user to evaluate the quality of his matched results.