Tissues & Cells

Expression-based analysis

The Tissues & Cells section in GeneAnalytics leverages the extensive expression data available in LifeMap Discovery® and provides detailed information about normal cells, anatomical compartments, organs, tissues and high throughput experiments whose reported gene expression profiles match your gene set. The results are also classified into tissues and systems. 

Expression-based, Tissues & Cells analysis by GeneAnalytics can help you:

  • Explore specific cells and tissues with gene expression signatures that match your gene set
  • Identify and characterize tissue samples or cultured cells and validate their purity
  • Discover new selective markers for tissues and cells
  • Evaluate cell differentiation protocols
  • Assess the quality of cell sorting or tissue dissection procedures

Gene expression data of disease-related tissues and cells can be viewed in the disease section


Data Types and Sources

Expression-based, Tissues & Cells analysis in GeneAnalytics relies on data that were manually collected from the scientific literature as well as data derived from high throughput experiments and further modeled, annotated and integrated into LifeMap Discovery.

The gene expression data is filtered to remove data lacking sufficient supporting evidence. In addition, data from mutant animals or from patients are not included in this section results, in efforts to eliminate incorrect association of aberrant gene expression profiles with normal tissues and cells.

The data available in LifeMap Discovery are obtained from the following sources (for a detailed explanation and list of sources please click here):

  • Peer-reviewed scientific literature.
  • High throughput experiments, such as microarray and RNA sequencing, available at GEO. The differentially expressed genes for each sample are calculated using a proprietary algorithm, allowing standardization of gene expression lists. (See an example of a gene expression comparison card in LifeMap Discovery). The differentially expressed genes calculation algorithm filters out genes which their expression is highly variable among the samples. Then, differentially expressed genes are identified using the e-bayesian method; a gene is defined as differentially expressed if its expression is altered by 2 or more fold changes between the compared sample and the p-value is equal to 0.05 or lower, after a correction for multiple comparisons (using the false discovery rate [FDR] method). 
  • Lists of differentially expressed genes derived from large scale data sets (LSDS):
  • In situ hybridization (ISH) and immunostaining (IS) data sets: these data sets include regional gene expression information for large numbers of genes in a variety of prenatal and postnatal tissues. A link to the image from the external database is provided for each gene.
  • Microarray, expressed sequenced tags (EST) analysis and RNA sequencing data sets: These data sets include lists of tissue/cell-specific genes for a large number of in vivo and in vitro samples.


Data Modeling

The following entities in LifeMap Discovery include gene expression information and are analyzed by GeneAnalytics for genes matching your gene set:


Entity typeAvailable dataNotesExample
  • Organ
  • Tissue
  • High throughput gene expression comparisons
  • Large scale data sets
These entities contain list of genes that have been found to be expressed in samples taken from the whole tissue. Heart
  • Anatomical compartment
  • High throughput gene expression comparisons
  • Large scale data sets
These entities describe specific temporospatial regions within an organ/tissue. Renal Collecting Duct System
  • In vivo cell
  • In vitro cell: cultured stem, progenitor and primary cell
  • Protocol-derived cell
  • Manually curated data from the scientific literature
  • High throughput gene expression comparisons
  • Large scale data sets
Inner Cell Mass Cells (ICM) Trabecular meshwork-derived mesenchymal stem cells
  • Large scale data set (LSDS) sample cards
  • Large scale data sets
These entities contain the gene list for each sample of an LSDS (see above for explanation about LSDSs)
These entities serve as a match for GeneAnalytics only if their gene list is not contained within any of the above card types.
GUDMAP: Ovary

Gene Annotations

The matching analysis in GeneAnalytics is based on gene annotations available in LifeMap Discovery for each gene in each entity. These annotations are based on information reported in the scientific literature and/or on bioinformatics calculations executed on expression data in LifeMap Discovery.

Each gene can have one or more of the following annotations:

  • Specific gene: a gene that is specific to or is expressed in only a few organs/tissues. 
  • Enriched gene: a gene that is expressed in many entities of the same organ/tissue.
  • Selective gene:  an established cell-specific marker or a gene suggested to be characteristic of the cell. Appears only in cell cards.
  • Expressed gene: a gene known to be expressed in the cell but not defined as a selective cell marker.
  • Abundant gene: a gene that is expressed in a large number of different organs/ tissues in LifeMap Discovery.
  • Housekeeping gene:  a gene that appears in a list of housekeeping genes established by integrating information from several studies (Eisenberg et al, 2013;  Ramskold et al, 2009; She et al, 2009; Zhu et al, 2008).
  • A gene with a low confidence level: a gene that originates from the analysis of a large scale dataset but does not have strong supporting evidence (for example, appear in a small number of cells in a specific organ).

To receive a list of all genes expressed in a specific tissue, organ or developmental path, including annotations for selective markers, specific genes and tissue-enriched genes, please contact us.
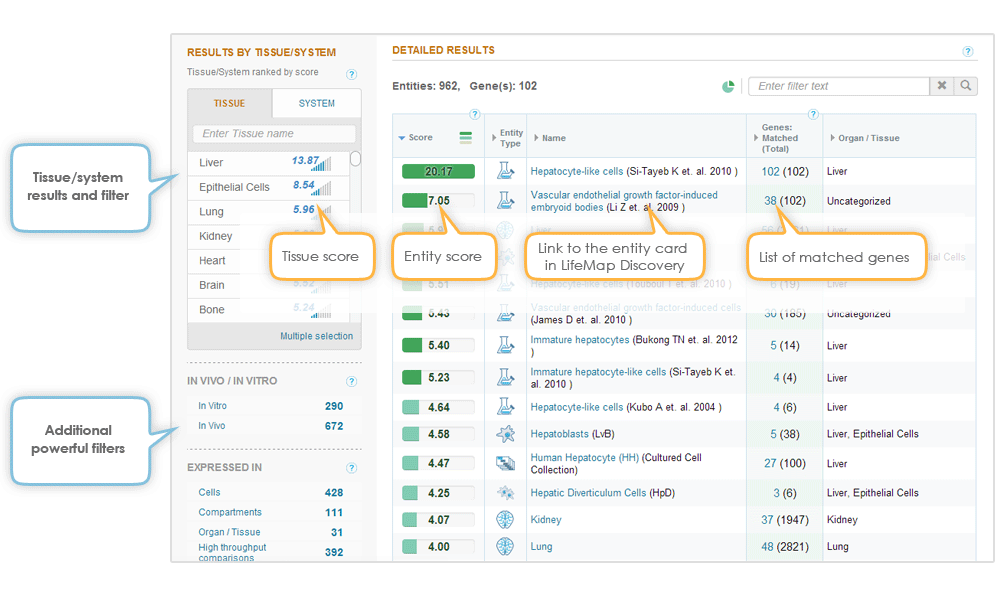
Results

  • GeneAnalytics allows you to query gene lists from either human or mouse.
  • The Tissues & Cells section results, however, are based on combined data from human, mouse and to a lesser extent from rat, chicken and pig, regardless of the source species of the query gene set.
  • The GeneAnalytics algorithm assembles all genes into ortholog groups which are based on homologene.
  • Tissues & Cells section results are presented on three levels:
    • Specific entities (tissues, organs, anatomical compartments, cells, large scale datasets samples)
    • Tissue classes
    • System classes
  • All the entities in LifeMap Discovery, in which at least one of the searched genes is expressed, are presented in the main results table. Each match to an entity contains the list of all matched genes and the evidence supporting the matching.
  • Powerful filters enable you to focus your results to specific tissues, entity types, developmental time or in-vivo/in vitro classifications.


Function results


Score calculation and presentation


  • Each gene in each entity has a matching score, which is based on the combination of annotations of all matched genes in the entity, and the entity type. The overall score for each entity, or tissue/system classification, is dependent on the number of matched genes and their scores.  
  • The quality of the match is assessed by the GeneAnalytics algorithm and is categorized as high, medium and low quality matches. The match quality level is indicated by the color of the score bar.
  • A distribution of the matching qualities across the results list is also presented to enable an easy assessment of the overall matching quality. 

Function Image

Start analyzing your gene sets

SIGN UP FREE >